|
|
|
|
File Search Statistics and Pie Charts
VX Search Server provides multiple types of statistical pie charts and timeline charts capable of showing the number of search results and the amount of disk space per directory, file extension, file type, file size, file owner, creation, modification and last access time. In order to open the charts dialog, press the 'Charts' button located on the main toolbar and select an appropriate chart type. 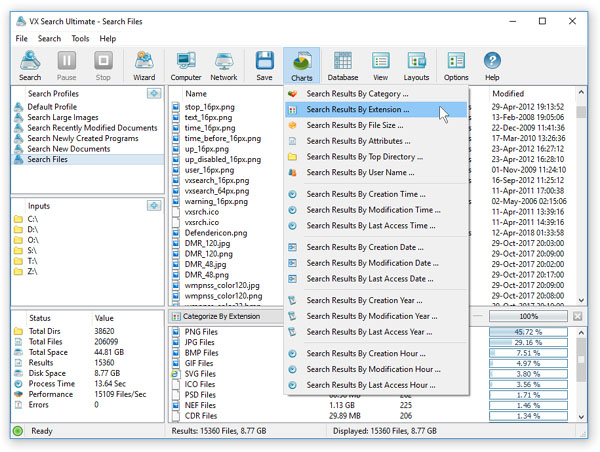
For example, in order to open a chart showing the number of search results and the amount of disk space per file extension, press the 'Charts' button located on the main toolbar and select the 'Search Results Per Extension' chart type. In addition, the charts dialog provides the user with the ability to export the chart data to a number of different formats and copy the displayed chart image to the clipboard allowing one to easily integrate VX Search charts into user's documents and presentations. In order to customize the chart's description, press the 'Options' button and specify a custom chart title, host name, date or time. 
One of the most powerful features of the VX Search file search utility is the ability to filter file search results using one or more user-specified filters and then categorize filtered results and display statistical pie charts. For example, in order to display a pie chart showing the number of search results per file extension for files that were modified during the last two years, set the file categorization mode to 'Categorize By Modification Year', select one or more years to show the information for, press the right mouse button over the file filters view and select the 'Apply Selected Filters' menu item. VX Search will filter the file search results and display search results that were modified during the selected years. Now, press the 'Charts' button located on the main toolbar and select the 'Search Results Per Extension' menu item. VX Search will categorize the filtered file search results and display a pie chart showing the number of search results per file extension for files that were modified during the selected years. In a similar way, the user can filter the file search results by the file type, size, user name, file attributes, creation, modification and last access dates and then display various types of charts showing file search results statistics according to the user-specific needs. Timeline Charts Another powerful capability is the ability to display the file search results timeline charts for all or filtered file search results. In the simplest case, press the 'Charts' button located on the main toolbar and select the 'Search Results Per Modification Year' menu item. VX Search will display a time line chart showing how much search results were modified per year. In order to display how much data was modified per year, set the chart mode to 'Disk Space Usage Per Modification Year'. 
In addition, the user is provided with the ability to display timeline charts for filtered file search results. For example, in order to display how many documents were created per year, set the file categorization mode to 'Categorize By File Type', select the 'Documents, Books and Help Files' file category, press the right mouse button and select the 'Apply Selected Filters' menu item. Now, press the 'Charts' button located on the main toolbar, and select the 'Search Results Per Creation Year' menu item. 
AI Integration and Data Analysis One of the most powerful capabilities of the VX Search file search solution is the ability to export file search results to AI-friendly file formats allowing one to easily import file search results to various AI platform, perform advanced analysis operations and generate user-custom charts. 
For example, in order to generate a timeline showing the number of file search results per file creation year using the ChatGPT AI platform, press the 'Charts' button located on the main toolbar, select the 'Search Results By Creation Year' chart type, export the chart data tothe JSON file format, import the JSON file to the ChatGPT AI platform and ask ChatGPT to display a timeline chart according to the uploaded JSON report file. 
In order to display a consolidated, stacked timeline chart showing the number of file search results per file creation and last modification year, open the VX Search GUI application, press the 'Charts' button located on the main toolbar, select the 'Search Results By Modification Year' chart type, export the chart data to the JSON file format, import the second JSON report file to the ChatGPT AI platform and ask ChatGPT to display a stacked time line chart.
|
VX Search News
|